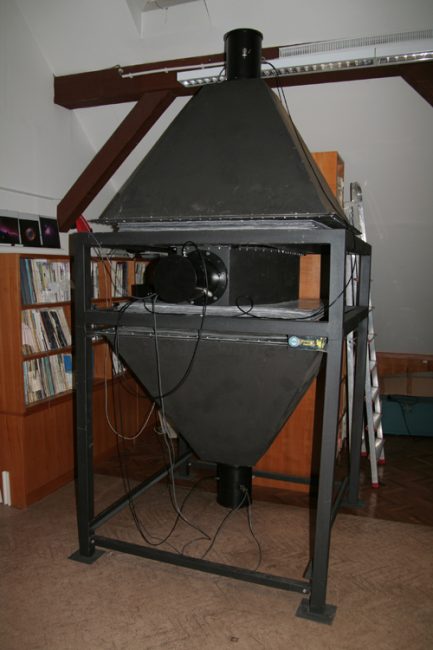
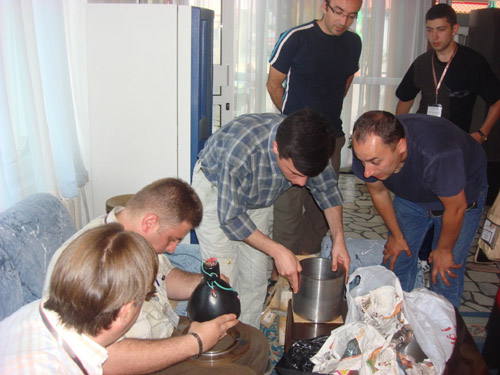
The installation of the SEVAN CRO particle detector at Zagreb Astronomical Observatory was finished in December 2008. It is the first instrument designed for detecting cosmic rays in Croatia and its installation greatly promotes solar physics research in this country. The detector is a fully autonomous unit, with the capability to send data via the Internet, and it is part of the SEVAN (Space Environmental Viewing and Analysis Network). The SEVAN network units are located at different latitudes, longitudes and altitudes and they are use for simultaneous measurements of flux of most species of secondary cosmic rays born in atmospheric cascade caused by primary ions and solar neutrons. The main scientific aim is to the improve research of solar particle acceleration in the vicinity of the Sun by detecting highest energy solar cosmic rays giving additional secondaries detected by surface particle detectors and to improve researches of the space environment conditions. The detectors are sensitive to very weak and poorly explored fluxes of high-energy solar cosmic rays above 10 GeV. Decices are also used for exploration of solar modulation effects on galactic cosmic rays. SEVAN started in the framework of the International Heliophysical Year and United Nations Basic Space Science projects (UNBSS) /(see also International Space Weather Initiative (ISWI)/
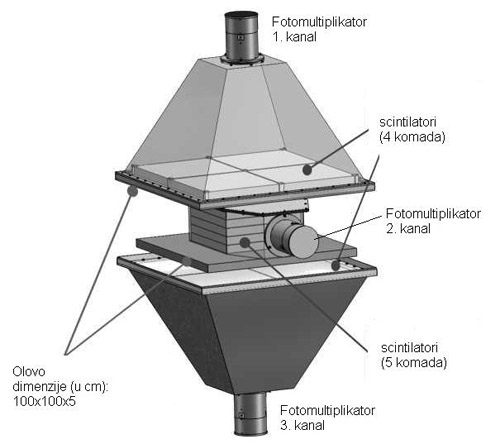
Particle detector SEVAN – schematic view
The SEVAN network of particle detectors (Space Environmental Viewing and Analysis Network) aims to improve fundamental research on solar physics and space weather conditions. Ground based particle detectors measure time series of secondary particles born in cascades in the Earth’s atmosphere by primary galactic cosmic rays. By detecting solar modulation effects it is possible to predict upcoming geomagnetic storms hours before the arrival of Interplanetary Coronal Mass Ejection’s (ICMEs) at the space-borne instruments. Huge magnetized plasma clouds and shocks initiated by Coronal Mass Ejections (CME) travel in the interplanetary space with mean velocities up to 2500 km/sec (the so called Interplanetary Coronal Mass Ejection (ICME), are known as major drivers of severe space weather conditions when arriving at the Earth. On their way to Earth ICMEs also “modulate” the flux of Galactic Cosmic Rays (GCRs) introducing anisotropy and changing energy (rigidity) spectra of the previously isotropic population of protons and stripped nuclei accelerated in the numerous galactic sources. Changes in the rather stable flux of GCR are detected by space-born spectrometers (rigidities up to ~1GV) and by world-wide networks of particle detectors (rigidities up to ~100GV) located at different latitudes, longitudes and altitudes.
The ICME is a major modulating agent, interacting with GCR, and introducing anisotropy in their flux. These anisotropies of GCR manifested themselves as peaks and deeps in time series of secondary cosmic rays, detected by surface particle detectors.
Therefore, the measurements of secondary fluxes can be used for “probing” ICMEs, providing highly cost-effective information on the key characteristics of these interplanetary disturbances. The size and magnetic field strength of ICMEs are correlated with the ICME modulation effects on the energy spectra and the direction of GCRs. At the same time the presence of strong and long-duration southward magnetic field component in the sheath region of ICMEs is the primary requirement for their geoeffectiveness. Thus, strong magnet field of the ICMEs is both modulation agent of GCR and driver of GMS.
The large Bz value associated with approaching ICMEs is a best known diagnostics of GMS strength. Therefore, appropriate observations of the variations of the primary and secondary cosmic rays can be a proxy of Bz value available long before IMCEs reach the L1 libration point where Bz is measured directly.
The ICME takes less than one hour to travel from the ACE or SOHO satellite to the magnetosphere. It is a too short time to take effective mitigation actions.
To establish a successful forecasting service by a network of ground based particle detectors we need to measure the time series of secondary particles (neutrons, low energy charged particles and high-energy muons) and to simulate and compare the correlation between changing fluxes and direction of detected particles. To meet this goal a new-type of particle detector (SEVAN detector) was designed and fabricated in Aragats Space Environmental Center (ASEC) of the Alikhanyan Physics Institute, Armenia. ASEC has a great experience with data analysis of multivariate time-series from ASEC monitors.
The SEVAN network is compatible with currently operating neutron monitor and muon telescopes networks.
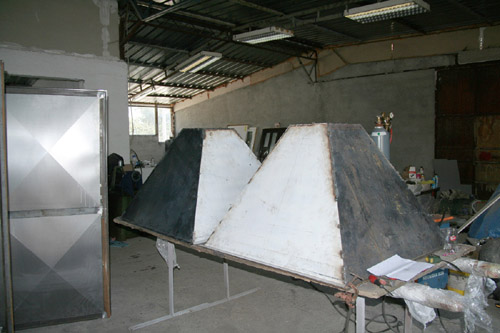
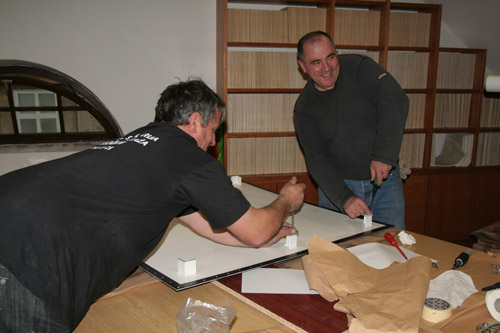
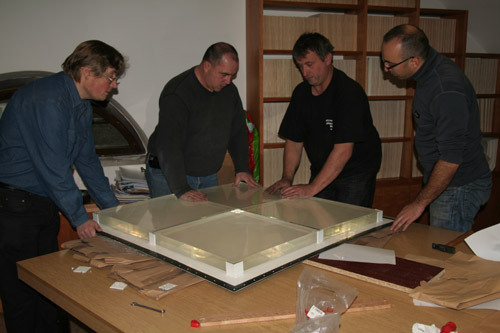
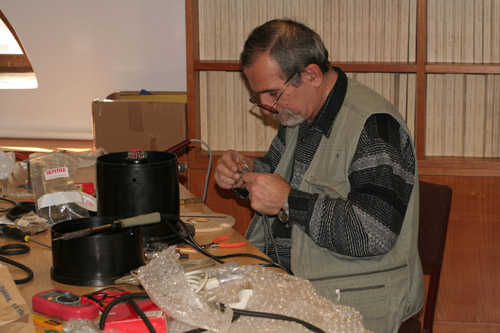
The installation of a SEVAN particle detector (SEVAN CRO) at Zagreb Astronomical Observatory (latitude 45.82 N; longitude 15.97 E; altitude 220 m; vertical cut-off rigidity ≈ 4.9 GV) was finished at the end of the year 2008. All necessary equipment, which includes scintillators, photo-multiplier tubes and electronics were provided by the Alikhanyan Physics Institute. The housing was made in Croatia. The installation was supported by the European Office of Aerospace Research and Development and the City government of Zagreb.
The threshold energy of the SEVAN module was estimated using three different methods: by calculation of ionization losses of muons in lead; by computer simulation of atmospheric cascade and response of the monitor to the secondary particles and by comparing a simulated spectrum and experimentally measured count rates. Analytical calculations are in good agreement with the simulation. The selective sensitivity of the SEVAN modules allows us to probe different populations of the primary cosmic ray flux from 7 GeV to 20-30 GeV and to classify Ground Level Enhancements (GLEs) in neutron or proton initiated events.
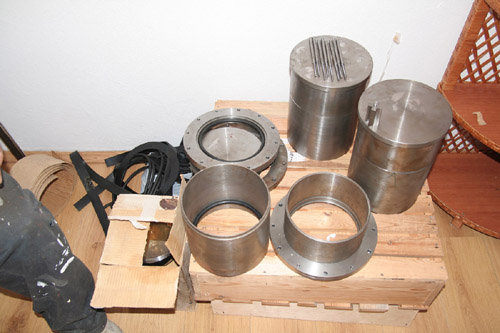
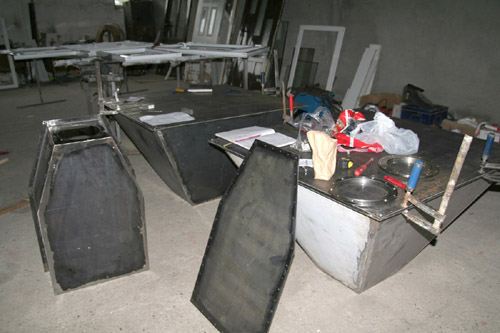
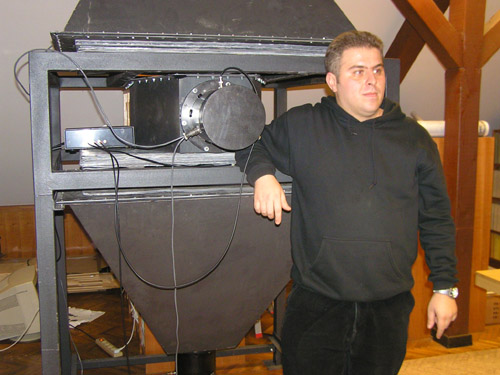
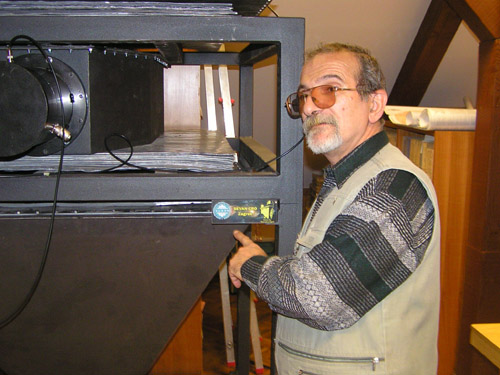
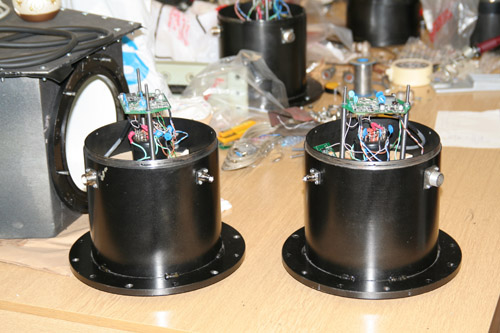
A SEVAN detector is assembled from standard slabs of 50·50·5 cm3 plastic scintillators. Two identical assemblies of four slabs scintillators are separated with two lead absorbers of size 100·100·5 cm3. Between the lead absorbers there is a thick scintillator assembly of the size 50·50·25 cm3 (five standard slabs). Each scintillator assembly is inside a light protected iron-made shielding with a photo-multiplier tube. So we have a 3-layer detector in which is possible to occur different combinations of the signals and absence of signals.
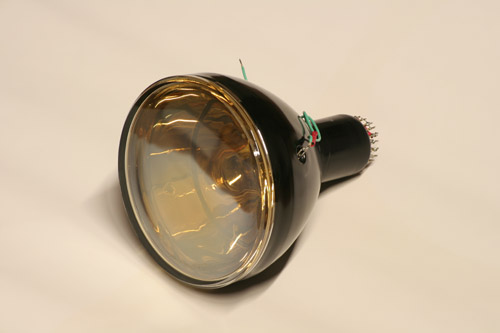
photo-multiplier tubes
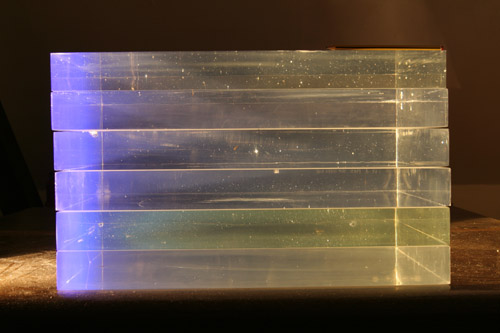
Plastic scintillators 50·50·5 cm3
If the signal appears only in the upper layer it represents the flux of low energy charged particles (mostly electrons and muons) filtered by 5 cm thick lead below the upper scintillators (energy of charged particles below 100 MeV). If we have a signal in the upper and lower layer (or in all three layers) it represents the transit of a high energy muon with minimal energy of about 250 MeV. Neutral particles undergo nuclear reactions in the 25 cm thick scintillators of the middle layer and produce protons and other charged particles. There is not enough substance in the upper 5 cm thick layer for nuclear reactions of neutral particles. If the signal appears only in the middle layer, it represents the neutral component of secondary cosmic ray fluxes. Some of the other possible combinations are when the signal appears in the upper and middle layer (transit of higher energy charged particle stopped in the second lead absorber) and when the signal appears only in the lower layer (represents inclined incidence of charged particles). SEVAN electronics (Arakelyan et al., 2009) provides registration and storage of all possible combinations of the signals for further analysis. Atmospheric pressure data are collected with a pressure sensor designed and fabricated in the Yerevan Institute of Physics.
One-minute measurements are stored in an output file in nine columns:
D1 – time
D2 – number of events (appearing signal) in the upper layer
D3 – number of events in the middle layer
D4 – number of events in the lower layer
D5 – atmospheric pressure
D6 – signal in the upper and middle layer (110)
D7 – signal in the upper and lower layer (101)
D8 – signal in the middle and lower layer (011)
D9 – signal in all three layers (111)
Count rates of low energy, high energy and neutral particles can be found by a simple calculation:
Low energy particles (100) = D2 – (D6 + D7 + D9)
Neutral particles (010) = D3 – (D6 + D8 + D9)
High energy muons (111&101) = D7 + D9
The measured counting rates of different species of secondary particles by SEVAN CRO are approximately:
6 500 low energy charge particles (100)
300 neutral particles (010)
4 000 high energy muons (111&101).
Useful links
SEVAN project:
http://crd.yerphi.am/space_environmental_viewing_and_analysis_network
Official page of Cosmic ray division (Yerevan Physics Institute):
NOTE: The calendar above is supplied for information purposes only.
Za promatranje Perzeida ne koriste se teleskopi i dvogledi (Opservatoriji u gradovima nisu prikladna mjesta za promatranje meteorskih rojeva). Korištenjem teleskopa ili dvogleda smanjuje se vidno polje, a za promatranje Perzeida potrebno je vizualno obuhvatiti što veći dio neba kako biste mogli vidjeti što veći broj meteora.
Perzeidi se promatraju golim okom na tamnim područjima, daleko od svjetlosnog onečišćenja gradova.
Za amaterska opažanja upravo su interesantni meteoridski potoci, čije staze Zemlja svake godine siječe u isto vrijeme, pa se unaprijed zna vrijeme za njihovo opažanje. Zbog perspektive, meteori potoka prividno izlaze iz jedne točke nebeske sfere (naime, meteoridi pripadaju jednoj skupini i gibaju se paralelno), koja se naziva radijant.
U medijima povremeno možemo pročitati najave da će se planeti “poravnati” nekog određenog datuma. Pri tome se zaboravlja na činjenicu da se planeti prividno cijelo vrijeme nalaze u približno istoj ravnini, odnosno da leže na istom pravcu, da se njihovi međusobni položaji sporo mijenjaju (pa “trenutak” može trajati danima) i da su cijelo vrijeme “poravnani”. Stoga se vjerojatno misli na konjunkciju više planeta, odnosno događaj kada se oni prividno nađu relativno blizu. Problem kod uočavanja takvih konjunkcija je da golim okom u prosječnim uvjetima vidljivosti možemo vidjeti maksimalno 5 planeta (Merkur, Veneru, Mars, Jupiter i Saturn, dok je Uran na granici vidljivosti golim okom), što znači da takve konjunkcije nisu česte. Pojam gore navedenog poravnavanja može se proširiti na događaj kada je tijekom noći iznad obzora istovremeno više sjajnih planeta i kada je bez problema moguće pratiti ravninu ekliptike uzduž koje su planeti raspoređeni. Za samo promatranje “poravnavanja” nije potrebna nikakva astronomska oprema. Dovoljno je naći neku lokaciju s koje je vidljiv veći dio nebeske sfere (prvenstveno južni dio od istoka do zapada) i uživati u pogledu. Dodatno, ako pri ruci imate teleskop onda ga možete iskoristiti kako biste upotpunili doživljaj.
Daljina vidljiva horizonta ovisi o visini na kojoj je motritelj i Zemljinoj zaobljenosti. Kada ne uzimamo u obzir Zemljinu atmosferu, njen iznos u kilometrima možemo izračunati tako da drugi korijen iz nadmorske visine motritelja (u metrima) pomnožimo s 3,57. Primjerice gledano s nadmorske visine 1000 m ona iznosi oko 113 km. Međutim, u stvarnosti ona može biti drastično veća. Razlog je promjenjivo fizičko stanje prizemnih atmosferskih slojeva u kojima staze svjetlosnih zraka zbog refrakcije (loma) imaju vrlo nepravilan oblik. Poseban je slučaj pri temperaturnoj inverziji (temperatura raste s visinom). Uz odgovarajući iznos temperaturnog gradijenta u atmosferi polumjer zakrivljenosti refraktiranih (prelomljenih) zraka može biti približno jednak Zemljinu polumjeru. U tom slučaju staze svjetlosnih zraka prate zakrivljenu Zemljinu površinu na putu od više stotina kilometara i moguće je i s male nadmorske visine (primjerice s brodske palube) vidjeti jako udaljene predmete. Ako se temperaturna inverzija ustabili na većem području (što je osobito u polarnim krajevima), ovaj učinak može značajno utjecati na vrijeme izlaska i zalaska Sunca. Prvi put to su uočili istraživači pod vodstvom Willema Barentsza krajem 16. stoljeća na polarnom području Rusije (Novaja Zemlja). Primijetili su da se Sunce vidi nad horizontom iako je prema astronomskim izračunima trebalo biti više od 2° ispod horizonta. Slične slučajeve su zabilježili i mnogi drugi pomorci, a nije čudo da recimo se iz Italije ponekad mogu vidjeti priobalna mjesta u Hrvatskoj. Neki znanstvenici smatraju da je temperaturna inverzija mogla biti razlogom tragedije Titanica, koji je nakon sudara sa santom leda potonuo u vedroj i hladnoj noći 15. travnja 1912. Zbog temperaturne inverzije daleki horizont prividno je uzdignut i puno je teže na takvoj pozadini uočiti santu leda. Lakše ju je uočiti kada je u pozadini vedro nebo i kada ona sakriva pogled prema dijelu neba na kojem tada ne vidimo zvijezde.
Nepoznavanje ili prešućivanje ove pojave zagovornici ravne Zemlje navode kao dokaz da Zemlja nije okrugla, jer bi tobože bilo nemoguće vidjeti tako udaljene predmete na zaobljenoj Zemljinoj površini. Da Zemlja nema atmosferu (recimo kao što je to slučaju kod Mjeseca) brzo bi se razuvjerili u te tvrdnje.
Na kraju spomenimo da je arapski astronom al-Biruni, eksperimentalnim mjerenjima vezanim uz daljinu vidljiva horizonta, još prije tisuću godina vrlo točno odredio iznos Zemljina polumjera. “Pogriješio” je za svega desetak kilometara.
U zadnje vrijeme sve je više upita građana vezano uz navedenu pojavu. Riječ je o satelitima iz serije Starlink tvrtke SpaceX kojih je do travnja 2020. g. lansirano nešto manje od 400. Više o satelitima možete naći na mrežnim stranicama upisom pojma “Starlink”. Trenutke njihove vidljivosti iznad nekog područja možete naći primjerice na: https://www.satflare.com/track.asp?q=starlink ili https://www.heavens-above.com/.
Posjeti Zvjezdarnici radi opažanja neba su mogući. Opažanje je moguće samo u slučaju vedrog vremena. Prostorije Zvjezdarnice nalaze se na zadnjoj etaži (treći kat) kompleksa zgrada u Opatičkoj 22. Za pojedinačne posjete građana ili manjih grupa (npr. obitelji i sl.) ulaz je besplatan i nije potrebna prethodna najava. Aktualne informacije o radnom vremenu možete naći na poveznici radno vrijeme, ili u zaglavlju ove stranice.
Glavnim teleskopom pod kupolom Zvjezdarnice posjetitelji uglavnom opažaju sjajnija nebeska tijela, poput Mjeseca, planeta i ponekih maglica. Mjesec je najbolje opažati u danima oko faze prve četvrti, kada ga vidimo u obliku srpa. Zbog vlastitog gibanja i gibanja Zemlje, planeti mijenjaju svoj položaj na zvjezdanom nebu, pa su pogodni za opažanje samo u određenim razdobljima. Od planeta najzanimljiviji su Jupiter sa svojim mjesecima i Saturn s lijepo vidljivim prstenom. Izgled noćnog neba, odnosno vidljivost pojedinih zviježđa, mijenja se tijekom godine. Tako primjerice Orionovu maglicu opažamo tijekom zime, Andromedinu galaktiku tijekom jeseni, dok prstenastu maglicu (M57) i kuglasti skup M13 možemo vidjeti tijekom ljeta i rane jeseni.
Povodom posebno atraktivnih astronomskih pojava (poput pomrčina, pojave kometa i sl.) organizira se posebni program opažanja.
Zvjezdarnica ne organizira promatranja meteora (Perzeidi – Suze svetog Lovre, Leonidi, Orionidi …) jer je njih najbolje opažati golim okom s lokacija koje nisu svjetlosno onečišćene, kao ni u medijima razvikane “jedinstvene događaje” poput “poravnavanja planeta”, supermjeseca i sl.
Školske (i druge) grupe primaju se uz prethodnu najavu (telefonski na broj 01/4851-355 ili e-mailom (info@zvjezdarnica.hr), radi dogovora i rezervacije termina. Uobičajeno se održi prikladno predavanje i upriliči razgledavanje Zvjezdarnice i astronomske opreme te opažanje teleskopom u slučaju vedrog vremena.
Podatke o izlascima i zalascima Sunca sa zadovoljavajućom točnošću možete naći na stranici https://izlazak-zalazak-sunca.com/. Alternativno, podatke o izlascima i zalascima Sunca također možete naći na stranici https://hr.meteocast.net/ gdje nakon odabira naselja pri dnu stranice kliknete na “izlazak i zalazak sunca u …”, ili na nekom od inozemnih servisa poput Time and Date (timeanddate.com) i sl.
Nažalost zvijezdu nije moguće kupiti (niti imenovati po svojoj želji) premda postoje internetske stranice koje se bave tobožnjom “prodajom” zvijezda. Imenovanje nebeskih tijela je u nadležnosti Međunarodnog astronomskog saveza (https://www.iau.org/), krovne svjetske astronomske organizacije koja na svojim stranicama (http://www.iau.org/public/buying_star_names/) daje detaljnije informacije o toj problematici.
Natjecanja od 2009. godine provodi AZOO tako da sve informacije o uvjetima i terminima treba potražiti na njihovim stranicama http://astronomija.azoo.hr/ i http://www.azoo.hr/. Natjecanja se provode na 3 razine (školska, županijska i državna), a za županijska natjecanja potrebno izraditi praktični rad (1-2 učenika po radu).
Arhiva natjecanja (uključujući testove s rješenjima) od 2001. do 2008 godine nalazi se na našoj stranici:https://zvjezdarnica.hr/edukacija/edukacija/natjecanja-iz-astronomije/
Na Zvjezdarnici moguće je nabaviti knjigu Elementarna Astronomija I. dio koja je prkladna za srednjoškolce, pogotovo za kandidate za državno natjecanje i međunarodnu olimpijadu (https://zvjezdarnica.hr/edukacija/izdavastvo/knjige/elementarna-astronomija-1-dio/). Na našoj stranici nalazi se poveznica na web izdanje knjige Astronomija 1 http://www.zvjezdarnica.hr/knjige/Astronomija1.pdf koja je namjenjena fakultativnoj nastavi astronomije u srednjim školama a dio njenog sadržaja pokriva i program za osnovne škole. Izdavačka kuća Element iz Zagreba izdala je udžbenik “Astronomija za učenike osnovne škole” autora V. Vujnovića. Isti autor objavio je dva udžbenika “Astronomija I. i II”. u izdanju Školske knjige koji su prikladniji za srednjoškolce. Školska knjiga je također izdala udžbenik pogodan za početnu nastavu u osnovnim školama i vidljiv je na poveznici: http://www.gimpoz.hr/repos/files/135076265000-udzbenik-sadrzaj.pdf. Uz udžbenike, kao dodatni materijali mogu se koristiti karte, posteri, časopisi (primjerice vidjeti poveznicu: https://zvjezdarnica.hr/edukacija/izdavastvo/), kao i različite internetske izvore.
Opsežni edukacijski prilozi nalaze se na našim stranicama e-škole http://eskola.zvjezdarnica.hr/.
Arhiva natjecanja (uključujući testove s rješenjima) od 2001. do 2008 godine nalazi se na našoj stranici:https://zvjezdarnica.hr/edukacija/edukacija/natjecanja-iz-astronomije/
U posljednje vrijeme često se u javnim medijima najavljuje pojava tzv. supermjeseca i to obično senzacionalno, kao da se radi o nekoj iznimnoj astronomskoj pojavi. Pojam supermjesec ne upotrebljavamo u astronomiji. On je prije nekoliko desetljeća uveden u astrologiju i odnosi se položaj Mjeseca u perigeju (ili u blizini perigeja) za faze mlađaka ili uštapa. Pažnju javnosti obično privuče slučaj je za faze uštapa Mjesec u perigeju (ili u blizini perigeja). Tada je Mjesec prividno veći i sjajniji negoli za uštapa koji nastupa u nekoj drugoj točki Mjesečeve staze udaljenijoj od Zemlje. Možda tada i zaslužuje naziv supermjesec. Mjesec je za uštapa u perigeju oko 14% prividno veći i oko 30% sjajniji negoli za uštapa u apogeju. Ipak, pitanje je da li mi možemo prepoznati tu razliku. Najbolje to potvrđuje pojava kada nam se čini da je puni Mjesec nad obzorom veći negoli kada zauzme položaj visoko nad horizontom, premda je u tom slučaju čak udaljeniji (za otprilike veličinu Zemljina polumjera) i u stvarnosti nešto manji. Astronomi i drugi znanstvenici (primjerice psiholozi) još uvijek nisu uspjeli u potpunosti objasniti ovu pojavu.
Učestalost nastupanja punog Mjeseca u perigeju (ili u blizini perigeja) vezana je uz iznose anomalističkog i sinodičkog Mjeseca. Četrnaest sinodičkih mjeseci traje otprilike koliko i 15 anomalističkih mjeseci, što iznosi nešto više od 413 dana. Otprilike u tom razdoblju ponavlja se nastupanje uštapa za perigeja, što kako vidimo i nije tako rijetko. Za uštapa koji se događaja u perigeju (ili u njegovoj blizini) Mjesec nije uvijek jednako udaljen od Zemlje. Odstupanja su relativno mala, puno manja od Zemljina polumjera pa kada uspoređujemo Mjesečevu udaljenost za uštapa u perigeju veći doprinos može imati položaj opažača, odnosno vrijeme opažanja.
Opatička 22, PP 487
10001 Zagreb
T: +385 1 4851355
F: +385 1 4851355
E: info@zvjezdarnica.hr
Find what interests you.
Did you know?
Copyright © 2006 — 2026 Zagreb Observatory. Web design and support: Stjepan Tafra. Privacy policy.